
Whale Cluster Briefing
Flagship report identifying coordinated large-holder groups, their historical overlap, and recent accumulation or distribution phases.
We cluster whale behaviour across on-chain networks, map transfer corridors, and report liquidity shifts in plain language — so your desk can act on capital flow, not candlestick lag.

Each engagement produces annotated cluster maps, transfer volume timelines, and liquidity concentration notes — written for portfolio managers who already know their markets but need earlier signal from wallet-level activity.
Flagship report identifying coordinated large-holder groups, their historical overlap, and recent accumulation or distribution phases.
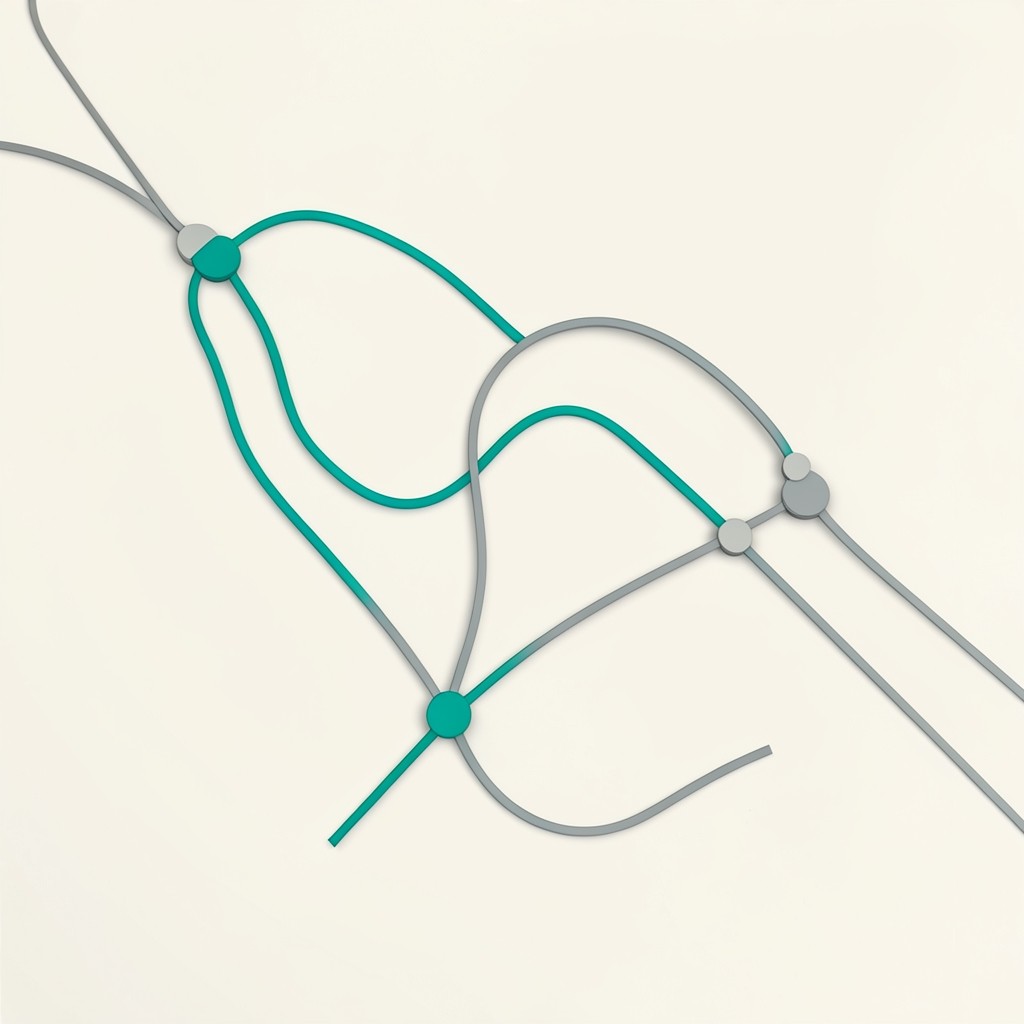
Ongoing tracking of corridor usage — which routes whales prefer when moving size, and when those routes go quiet.

Pool-level depth changes tied to identifiable wallet clusters, so you see where exit pressure may build before spreads widen.
Standard charts summarise what already traded. Whale clusters show who is positioning, which wallets move together, and whether liquidity is being pulled or parked. Our clients use these reads to stress-test entries, size hedges, and question narratives that price alone cannot confirm.
We do not sell access to a dashboard. You receive analyst-written briefings with the underlying cluster IDs, transfer hashes where relevant, and a clear statement of what changed since the last report.
The cluster map for our ETH desk flagged a dormant group waking up three days before the unwind. We had time to reduce spot exposure without chasing the move down.
— Portfolio manager, London multi-strategy fund
Reading cluster dormancy breaks before spot reacts — when a labelled whale group resumes transfers after weeks of silence, what usually follows.
Why transfer volume often leads candlestick patterns — capital must move before it prints on an exchange chart.